Suppose that the graph of the function
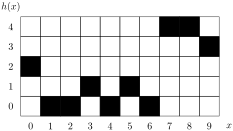
\(h\) is given by
The values on the horizontal axis of the plot are the elements of domain of \(h\text{.}\) So the domain of is
\begin{equation*}
\mathbb{Z}_{10}=\{0,1,2,3,4,5,6,7,8,9\}\text{.}
\end{equation*}
The codomain are the values on the vertical axis of the plot. Thus the codomain of \(h\) is
\begin{equation*}
\mathbb{Z}_{5}=\{0,1,2,3,4\}\text{.}
\end{equation*}
The graph of \(h\) are the elements of the Cartesian product \(\mathbb{Z}_{10}\times\mathbb{Z}_5\) which are represented by the black pixels in the plot. We find that the graph of \(h\) is
\begin{equation*}
\{ (x,h(x)) \mid x \in A \} = \{
(0,2),
(1,0),(2,0),
(3,1),
(4,0),
(5,1),
(6,0),
(7,4),(8,4),(9,3)
\}.
\end{equation*}
Because the graph of \(h\) consists of the pairs \((x,h(x))\) where \(x\) is an element of the domain of \(h\text{,}\) we can read off the values \(h(x)\) easily.